As shown in Tracing FreeRTOS with a Hardware Probe: I have a nice hardware probe to trace out events from my application. But what about to use the target memory as trace buffer? New devices have much more on-chip memory, so this could be an attractive option. That was on my list of future extensions, but then the news came in: Percepio announced their collaboration with FreeRTOS+Trace: exactly what I needed!
It is using the same concept as the FreeRTOS Trace Probe: the trace hooks provided by the FreeRTOS API. But instead streaming it off the target as with the FreeRTOS Trace probe, it is using a RAM buffer on the device. The real cool thing is: the Percepio trace viewer is very, very nice!
FreeRTOS+Trace from Percepio is not open source, but they offer a free of charge version. You can download the library sources after requesting it from the Percepio web site. The Trace viewer comes in three editions: Free, Standard and Professional. With the installation you get as well a 30 day Professional Evaluation license mode. The Free Edition comes with the basic functionality to view the tasks scheduling information. From the Free Edition you can switch to the Standard and Professional Edition, but you will be limited to a demo trace. Still, this gives you a good preview what you can expect in the other editions.
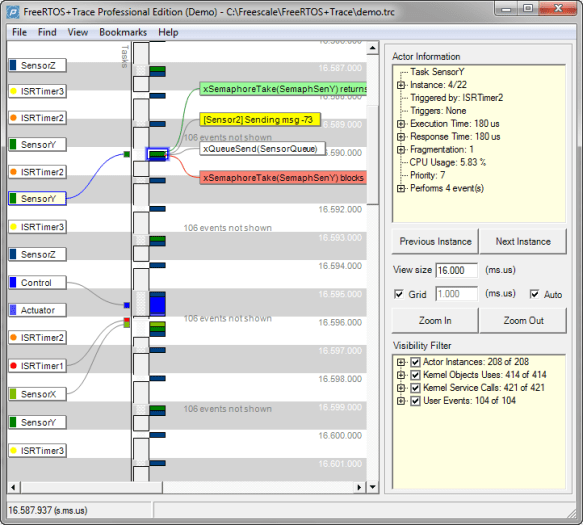
Now here some screenshots so you see why the Percepio FreeRTOS+Trace is really cool. The main window shows the flow of tasks with many information:
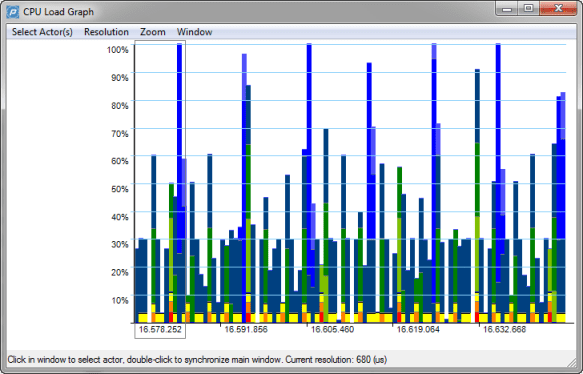
The CPU load graph gives a visual indication of the system load:
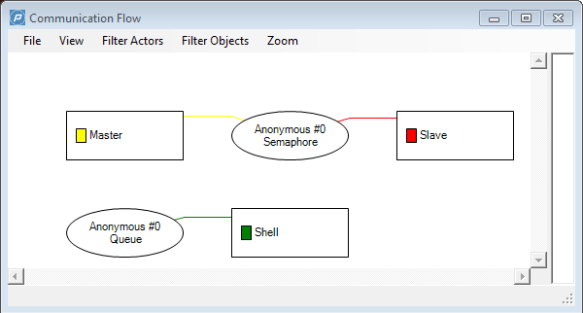
Cool is as well the communication flow view:
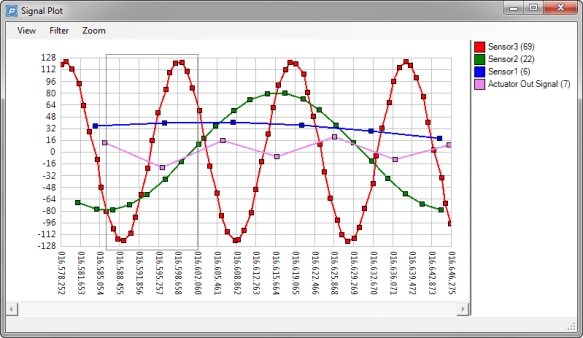
The application can add user events to the trace, which then can be visualized in the Signal Plot:
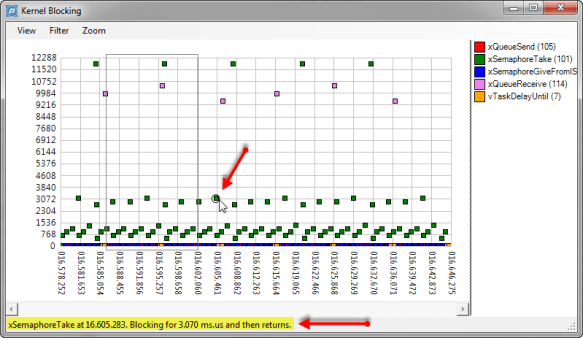
And if I want to know more about what the kernel blocking API calls: there is a view for that too:
But how to get it hooked up to my system? As you know from my other posts, my answer is: I use Processor Expert :-).
With the FreeRTOS Hardware Trace I have a good base. So what I need is instead tracing to an external hardware, I need to trace to RAM and using the FreeRTOS+Trace API library. To make things really easy to use, I have extended the existing FreeRTOSTrace component and created a new PercepioTrace Processor Expert component. Additionally I have changed the FreeRTOS component to use a free running counter instead of a normal timer interrupt: this allows me to gather performance data for the Percepio Trace.
Here is how this looks like:
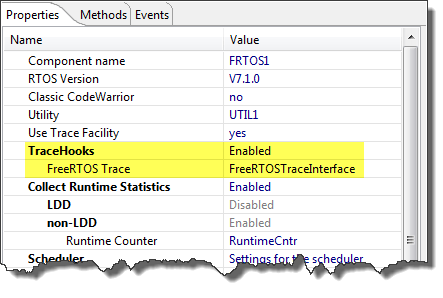
I enable the TraceHooks property in the FreeRTOS component:
The FreeRTOSTrace component will create all the FreeRTOS hooks for my application. In the inherited FreeRTOSTrace component, I simply enable Percepio Trace and enable the hooks I want to use:
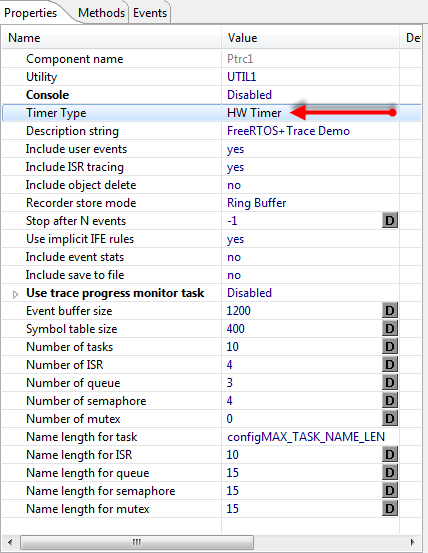
In the Percepio Trace component, I can configure all the different settings. I can configure if I want to run a console and a separate progress task, define the buffer size and configure the Timer Type: RTOS Ticks or using a Hardware Timer:
That way, the FreeRTOS component inherits the FreeRTOSTrace component, which then inherits the PercepioTrace component:
Adding trace collection to my application is easy: I need a custom debug print out function. The trace module gets initialized with vTraceInit(). And starting trace collection is done with vTraceStart():
#include "Ptrc1.h" void DBGU_Print_Ascii(char * buffer) { FSSH1_SendStr((unsigned char*)buffer, FSSH1_GetStdio()->stdOut); } void main(void) { /*** Processor Expert internal initialization. DON'T REMOVE THIS CODE!!! ***/ PE_low_level_init(); /*** End of Processor Expert internal initialization. ***/ Ptrc1_vTraceStart(); APP_Run(); /* runs the RTOS and all tasks....*/ /*** Don't write any code pass this line, or it will be deleted during code generation. ***/ /*** Processor Expert end of main routine. DON'T MODIFY THIS CODE!!! ***/ for(;;){} /*** Processor Expert end of main routine. DON'T WRITE CODE BELOW!!! ***/ } /*** End of main routine. DO NOT MODIFY THIS TEXT!!! ***/The library comes with an option to write the trace to an file system. If I find time, I’ll configure it to use the FatFS component I already have created.
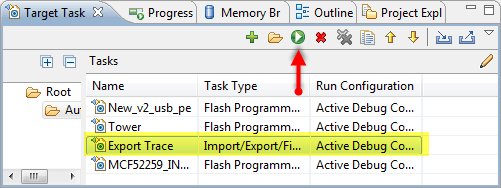
The simplest way to get the trace data is to run the application and stop it with the debugger, then dump the trace information. To save the trace to a file, I can use a target task to export and save a memory block: I specify the Recorder Data variable (&RecorderData), the file name and the size (which depends on your trace data structure):
Then I can dump anytime the data using the target task execute button:
As with the target task I need to specify the size of the memory, this sometimes is not ideal. The good thing is: the trace data has special markers in it, so you can dump as well your whole memory: the Percepio Trace Viewer will find the trace data in the dump.
Another way is to use the CodeWarrior Debugger Shell (menu Window > Show View > Debug > Debugger Shell) and to run the following script:
set start_addr [evaluate &RecorderData] set end_addr [evaluate ((char*)&RecorderData) + sizeof(RecorderData) - 1] save -b $start_addr..$end_addr c:\\tmp\\myTrace.dump -oUPDATE: For MCU10.5, the following script needs to be used:
set start_addr [evaluate &RecorderData] set end_addr [evaluate ((int)&RecorderData) + sizeof(RecorderData) - 1] save -b $start_addr..0x[format %04X $end_addr] c:\\tmp\\myTrace.dump -oThis does the same thing as the target task, but calculates the exact size of the trace data structure:So far, this is working great. I have it working for all the ColdFire V2 cores and all the S08 cores.
What is next?
- Port it to FreeRTOS+Trace v2.2.1 (just has been released today)
- Supporting all S12 and S12X/XGATE: should be easy 🙂
- Support for all Kinetis: a challenge with the LDD drivers, but will make it work
- Storing trace data on an SD card using FatFS component
- Using FSShell as console/output channel
- Support for Hawk/DSC. But here I need to finish and polish my FreeRTOS port first
So a lot of night and week-end work. I’ll keep things posted…..
Happy Perceptioning 🙂





Fantastic work!
LikeLike
Amen
LikeLike
The FreeRTOS+Trace component has been enhanced and published on http://www.steinerberg.com/EmbeddedComponents/PercepioTrace/home.htm
LikeLike
Pingback: FreeRTOS V7.1.1 released | MCU on Eclipse
Pingback: Percepio FreeRTOS+Trace V2.2.2 released | MCU on Eclipse
Pingback: The Making Of RTOS Processor Expert Components | MCU on Eclipse
Pingback: Breakpoints with Special Effects | MCU on Eclipse
Pingback: There is an ARM to Trace | MCU on Eclipse
Pingback: CDE Hacking: Components with Multiple Files | MCU on Eclipse
Pingback: Sumo Robots, one Week until Tournament | MCU on Eclipse
Pingback: Updated McuOnEclipse Components: USB for KL24Z, FatFs v0.10c, Shell Backspace and FreeRTOS Trace Hook Configuration | MCU on Eclipse
Pingback: FreeRTOS Continuous Trace Streaming | MCU on Eclipse